
Order book data shows the live supply and demand waiting to trade at each price, and that is the gap it fills for anyone who has only ever looked at candles. A candlestick compresses finished trades into an interval. An order book exposes resting buy and sell interest, the quantity available at each level, and the price at which the next trade could actually happen. For a quant desk or a trading bot, the live question is rarely just whether a market is rising. It is whether enough executable liquidity exists at acceptable prices, and whether that displayed liquidity will still be there when the order arrives.
That is why order book data explained properly has to start with intent versus execution. Displayed orders are intentions. They can be canceled, replenished, or hidden. Trades are the record of what cleared. Read together, they let you estimate slippage, measure depth, and build fill models that do not flatter your strategy. This guide walks through the mechanics, the core metrics, the data formats you will encounter, and the checks that separate a usable dataset from a misleading one.
Table of contents
What order book data actually contains
An order book is a continuously changing list of limit orders, organized into two sides. Bids are buy orders arranged by price; asks are sell orders arranged by price. Each entry carries a price level, a quantity available at that level, and a timestamp or sequence number marking when the update was observed or processed. A central limit order book, or CLOB, matches compatible buy and sell orders according to price and time priority. Polymarket's market-data documentation describes a CLOB in which each outcome has a tradable outcome token, and the book displays the resting bids and asks for that token.
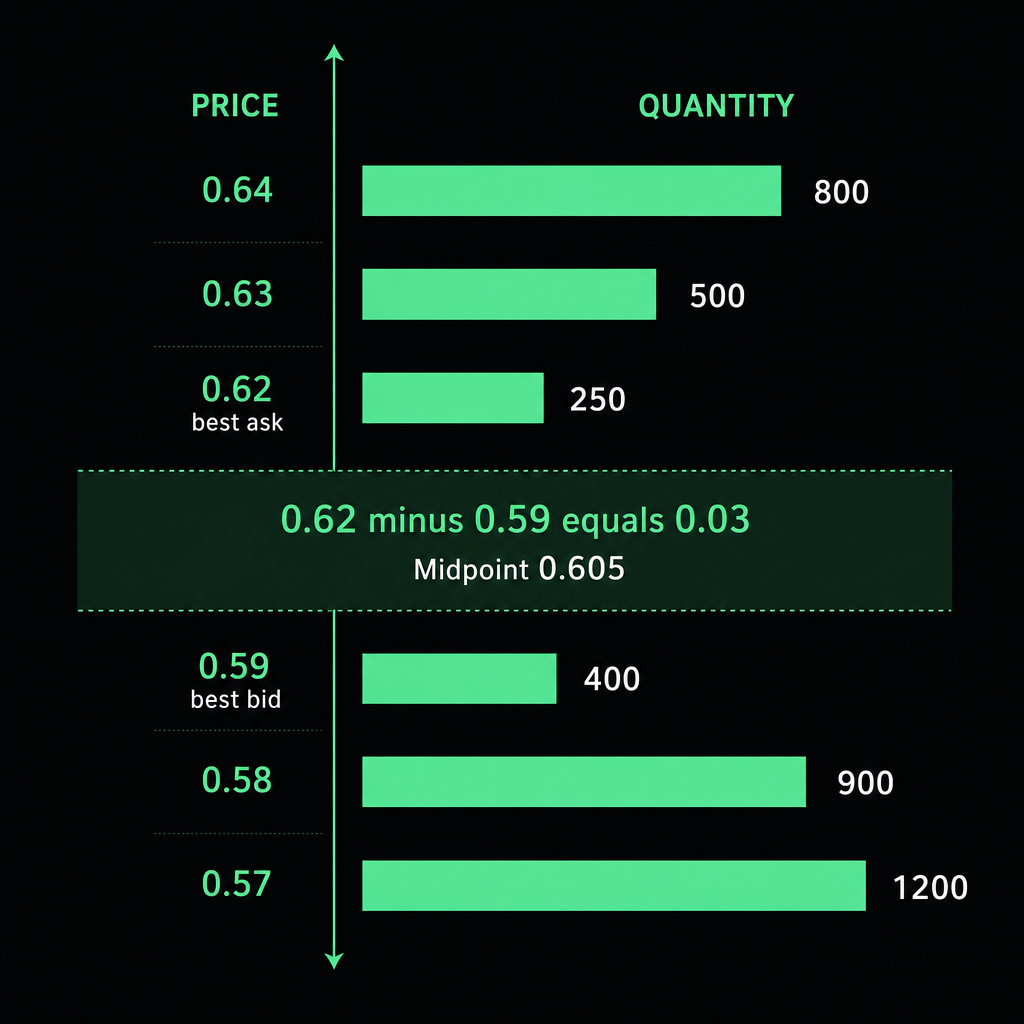
The highest bid is the most aggressive buyer; the lowest ask is the most aggressive seller. When the best bid and best ask overlap, the matching engine can execute. A simplified book makes the structure obvious:
| Side | Price | Quantity |
|---|---|---|
| Ask | 0.64 | 800 |
| Ask | 0.63 | 500 |
| Best ask | 0.62 | 250 |
| Best bid | 0.59 | 400 |
| Bid | 0.58 | 900 |
| Bid | 0.57 | 1,200 |
The space between the best bid and best ask is where the market quotes itself. Everything useful in order book analysis flows from reading that gap and the quantities stacked behind it.
The core metrics: spread, depth, and imbalance
Four measurements carry most of the decision weight. The best bid is the highest displayed buy price; the best ask (the offer) is the lowest displayed sell price. A marketable order interacts with the best price first, then walks through deeper levels if it is larger than the quantity there.
The bid-ask spread is best ask minus best bid. For the book above, 0.62 − 0.59 = 0.03. A narrower spread usually signals lower immediate trading friction; a wider spread points to thinner liquidity, higher uncertainty, or an inactive market. To compare across markets, traders use the relative spread, which divides the spread by the midpoint, where the midpoint is the average of best bid and best ask. The midpoint is a convenient reference price, but it is not executable: a buyer pays the ask, a seller receives the bid.
Market depth is the quantity available across multiple levels, and it answers a question the spread cannot. A market can post a tight spread yet hold almost nothing behind the top level. Small orders execute efficiently; larger ones suffer real price impact. Cumulative depth makes this concrete by adding quantities as you move up the book:
| Ask price | Quantity at level | Cumulative |
|---|---|---|
| 0.62 | 250 | 250 |
| 0.63 | 500 | 750 |
| 0.64 | 800 | 1,550 |
Buying 700 units consumes the 0.62 level entirely and 450 units at 0.63. The expected average fill is (250 × 0.62 + 450 × 0.63) ÷ 700 ≈ 0.6264. The order does not clear at one price; it walks up the book, and the blended cost is what you actually pay.
Top-level imbalance compares displayed bid quantity to ask quantity over the same window: (bid quantity − ask quantity) ÷ (bid quantity + ask quantity). A positive value means more displayed buying interest in that window, a negative value the opposite. Treat it as a market-state descriptor, not a forecast. Displayed orders get canceled, hidden liquidity exists, and a large resting order can be passive market-making rather than directional conviction.
Order book data versus trade data
Order book data describes intentions that are currently displayed. Trade data describes executions that actually occurred. Confusing the two is the most common modeling error newcomers make.
| Data type | What it shows | Typical use |
|---|---|---|
| Book snapshots | Bids and asks at a point in time | Liquidity, spread, depth |
| Book deltas | Changes to price levels | Reconstructing the live book |
| Trade prints | Executed price, quantity, time | Aggression, volume, realized flow |
| Candles | Aggregated OHLC and volume | Charting, lower-resolution analysis |
| Funding / settlement | Contract payments or outcomes | Perpetual and prediction-market research |
A candle can tell you price moved from 0.59 to 0.63. It cannot tell you whether that move went through a deep book, a thin book, or a run of large market orders. Tick-level books and trades preserve that path, which is exactly what you need to replay a strategy honestly. Our platform is built around that distinction: we deliver full order books and trades across Polymarket, Kalshi, Binance, and Hyperliquid, with the explicit goal of replaying tick-level books rather than leaning on candles. You can browse the underlying coverage in our dataset catalog and see how we structure Polymarket data specifically.
How traders put the book to work
Before sending a large order, you can simulate it against current levels to estimate the average execution price, the worst displayed fill, slippage relative to the midpoint, the share of the order that fills immediately, and which levels get consumed. That is far more honest than assuming the whole order clears at the last traded price.
Liquidity measurement follows the same logic at portfolio scale. Summing the quantity available within a price band of the midpoint — say ten basis points — gives a liquidity figure tuned to your horizon. A narrow band suits high-frequency execution; a wider band suits a rebalance. Combined with the imbalance and spread readings above, this lets a strategy classify regimes: tight spread with a deep book, tight spread with a shallow book, wide spread with asymmetric depth, a rapidly churning book, or a stable book with low trade activity. Each regime argues for different behavior — passive limits, aggressive takes, smaller clips, or standing aside.
Order-flow pressure is where book updates and trade prints earn their keep together. Aggressive buys repeatedly lifting asks, aggressive sells hitting bids, bids replenishing after trades, asks depleting without a price move, or rapid cancellations around an event all read differently when you can see both displayed and executed activity. A static snapshot alone cannot reveal how long a level survived or whether it ever traded.
For backtesting, historical book data supports a far more realistic fill model than candles. A simulator can replay available quantity at each price, update arrival times, trade prints, queue changes, and the liquidity consumed by prior orders. It still will not guarantee live-equivalent fills unless the data is accurately timestamped and the simulator models queue position, latency, fees, partial fills, and cancellations. Our backtest hub and trading use-case pages are organized around exactly this workflow.
Snapshots, deltas, and depth levels
"Order book data" is not one product. A snapshot is the book state at a particular time — easy to query, well suited to historical liquidity studies, periodic monitoring, and research datasets. Its weakness is sampling: if the interval is too long, short-lived liquidity and fast moves vanish between observations.
A delta contains only changes to existing levels. A typical update adds a level, changes the quantity at a level, or removes a level when its quantity reaches zero. Deltas are efficient for live systems, but the consumer must maintain a correct local book. Binance's depth-stream documentation requires a client to combine an initial REST snapshot with buffered WebSocket updates, apply them in sequence, and restart if events were missed; it also specifies that a zero quantity removes a price level.
Granularity matters too. Level 2 data aggregates quantity by price level — how much sits at each price, but not which individual orders compose it. Level 3 data, where offered, preserves individual order-level detail and can support queue-position and order-lifecycle analysis, at the cost of heavier storage and complexity. A spread dashboard may need only top-of-book. A fill simulator needs full depth and trades. A queue model needs order-level events. Match the granularity to the question, not to ambition.
Choosing a delivery method
The right access surface depends on whether you are querying once, streaming continuously, or crunching history in bulk.
| Requirement | Usually suitable | Why |
|---|---|---|
| One-time current lookup | REST API | Simple request-response access |
| Live bot or dashboard | WebSocket stream | Updates without repeated polling |
| Large historical backtest | Bulk Parquet / CSV | Efficient for local analytics and warehouses |
| Interactive research | REST plus files | Exploration with repeatable datasets |
| Tool-using AI agent | MCP server or structured API | Agents discover and query via defined tools |
We expose timestamped snapshots, deltas, trades, and settlement events through our REST API, live book deltas and prints through WebSocket streams, and daily Snappy Parquet/CSV files through bulk files for research and warehouse workflows. For a historical strategy, bulk files beat requesting individual records one at a time. For a live bot, a stream beats polling. For an AI agent, consistent schemas, documentation, and machine-readable catalog metadata matter as much as raw latency, which is why we keep field definitions aligned across REST, streams, files, and our MCP server.
What to check before you trust a dataset
Venue and instrument coverage come first. Confirm the exact venue, market type, symbols, contracts, and date range, because spot markets, perpetual futures, and prediction-market outcome tokens have different trading and settlement mechanics. Our published coverage treats Polymarket and Binance spot and perpetual data as live, while Hyperliquid and Kalshi are listed as recording or coming soon; verify current availability and the exact instrument universe before you build a production dependency on any specific market.
Historical continuity is the next test. Ask when recording began, whether gaps exist, whether timestamps are exchange-side, collector-side, or both, whether maintenance periods are represented, whether delisted or resolved markets are retained, and whether reconnects and missed messages are documented. A short sample is fine for development and inadequate for regime analysis.
Snapshot and delta semantics deserve explicit answers: whether quantities are absolute or incremental, whether prices are decimals, ticks, or integers, how deletions are encoded, how sequence numbers work, how a local book is initialized, and what happens after a gap. Two feeds that look similar can produce materially different books without these definitions.
Timestamp quality decides whether execution research is even possible. Check precision (milliseconds, microseconds, nanoseconds), clock source, event time versus receipt time, ordering guarantees, duplicate handling, and cross-venue synchronization. Depth and completeness close the list: "order book" might mean five levels, twenty levels, or full depth. Binance distinguishes partial depth streams, which provide selected top levels, from diff-depth streams used to maintain a local book — confirm the maximum depth you actually receive and whether historical data is full-depth. Finally, pair the book with trade prints and supporting fields — maker/taker side, funding, mark price, settlement or resolution, market status, and contract metadata — so a book-only view is never mistaken for a complete execution or P&L model.
Risks that quietly break order book analysis
Displayed liquidity can disappear. A resting order is not a guarantee of execution; it can be canceled before you reach it, and large displayed quantities are sometimes placed to be pulled. Snapshots can hide the path, too — two similar-looking snapshots may bracket heavy cancellations, trades, and replenishment, so snapshot frequency directly shapes what a researcher can conclude.
Sequence gaps are more insidious. If a delta is missed and the client keeps applying later updates, the local book silently goes wrong with no obvious error. A robust consumer detects gaps and rebuilds from a fresh snapshot — Binance documents exactly this recovery requirement for its depth stream. Alongside that, remember that the last trade is not an executable price; it may be stale or sit at a level no longer available, so execution models should use the contemporaneous bid and ask rather than a last-price field.
Backtests overestimate fills by default. Filling every buy at the midpoint or assuming unlimited top-of-book quantity produces optimistic results; realistic models account for spread, depth, partial fills, latency, queue position, fees, cancellations, and market impact. One domain-specific caution: prediction-market prices represent the traded value of an outcome token and may be read as an implied probability only under simplifying assumptions. They are shaped by contract wording, resolution rules, liquidity, and market completion, so never treat a token price as a guaranteed probability or compare it mechanically with a crypto spot price. If you are working with that asset class, our Polymarket historical data guide covers the retrieval specifics.
A workable research dataset normally combines book state or updates, executed trades, instrument and market metadata, venue fees and rules, and settlement, funding, or resolution events where applicable. With those pieces aligned under one consistent schema, a workflow can move from exploration to backtesting to live monitoring without changing its mental model of the data.
Frequently asked questions
Is order book data better than candlestick data?
Neither is universally better. Candles are compact and useful for trend, volatility, and broad historical analysis. Order book data wins when spread, liquidity, execution cost, queue behavior, or short-horizon order flow matters.
What is the difference between market depth and order book data?
Market depth is one component of order book data: the quantity available at multiple price levels. The broader dataset can also include timestamps, updates, sequence numbers, trades, market metadata, and related events.
What do I need to backtest order-book strategies?
At minimum, time-ordered book data with defined snapshot or delta semantics, trade prints, timestamps, instrument metadata, and a fill model. Serious execution research also needs gap detection and realistic partial fills.
Can order book imbalance predict price?
It can act as a market-state or short-horizon signal, but it is not a reliable standalone prediction. Orders get canceled, hidden liquidity exists, and the relationship varies by venue, instrument, horizon, and regime.
Should I use REST or WebSocket order book data?
Use REST for individual queries, snapshots, and simpler research. Use WebSocket streams for continuously changing books and low-latency applications. For large historical studies, use bulk files such as Parquet or CSV.